

Have you ever wondered why grocery stores place the peanut butter right next to the jelly, or why an online retailer suggests a specific phone case the moment you add a new smartphone to your digital cart? This is not random luck or simple intuition. It is the result of a powerful data mining technique known as Market Basket Analysis. By studying consumer habits, businesses can predict what you want before you even realize it yourself.
Understanding how people shop is the ultimate cheat code for retail success. Market Basket Analysis looks at the combinations of items that consumers place in their shopping baskets during a single visit. Whether you are running a small local boutique or managing a massive e-commerce platform, this strategy offers deep insights into human behavior, optimization, and revenue growth.
The Core Concept
At its heart, Market Basket Analysis is built on association rule mining. This is a data science concept that looks for relationships between large groups of items. The system analyzes historical transaction data to find patterns that occur much more frequently than random chance would suggest.
The classic, almost legendary retail story involves beer and diapers. As the story goes, a major supermarket chain ran a data analysis and discovered a strong correlation between young fathers buying diapers on Friday evenings and simultaneously grabbing a six pack of beer. While they were at the store picking up supplies for the baby, they decided to reward themselves for the upcoming weekend. By moving the beer closer to the diaper aisle, the store saw a massive spike in sales for both products.
Whether that exact story is a marketing myth or absolute reality, the logic remains flawless. People buy things in patterns. Finding those patterns allows businesses to transition from reactive selling to predictive selling.
The Mathematical Framework
To make sense of these shopping baskets, data scientists rely on three critical metrics. You do not need an advanced degree in mathematics to understand them, as they represent basic logic applied to retail data.
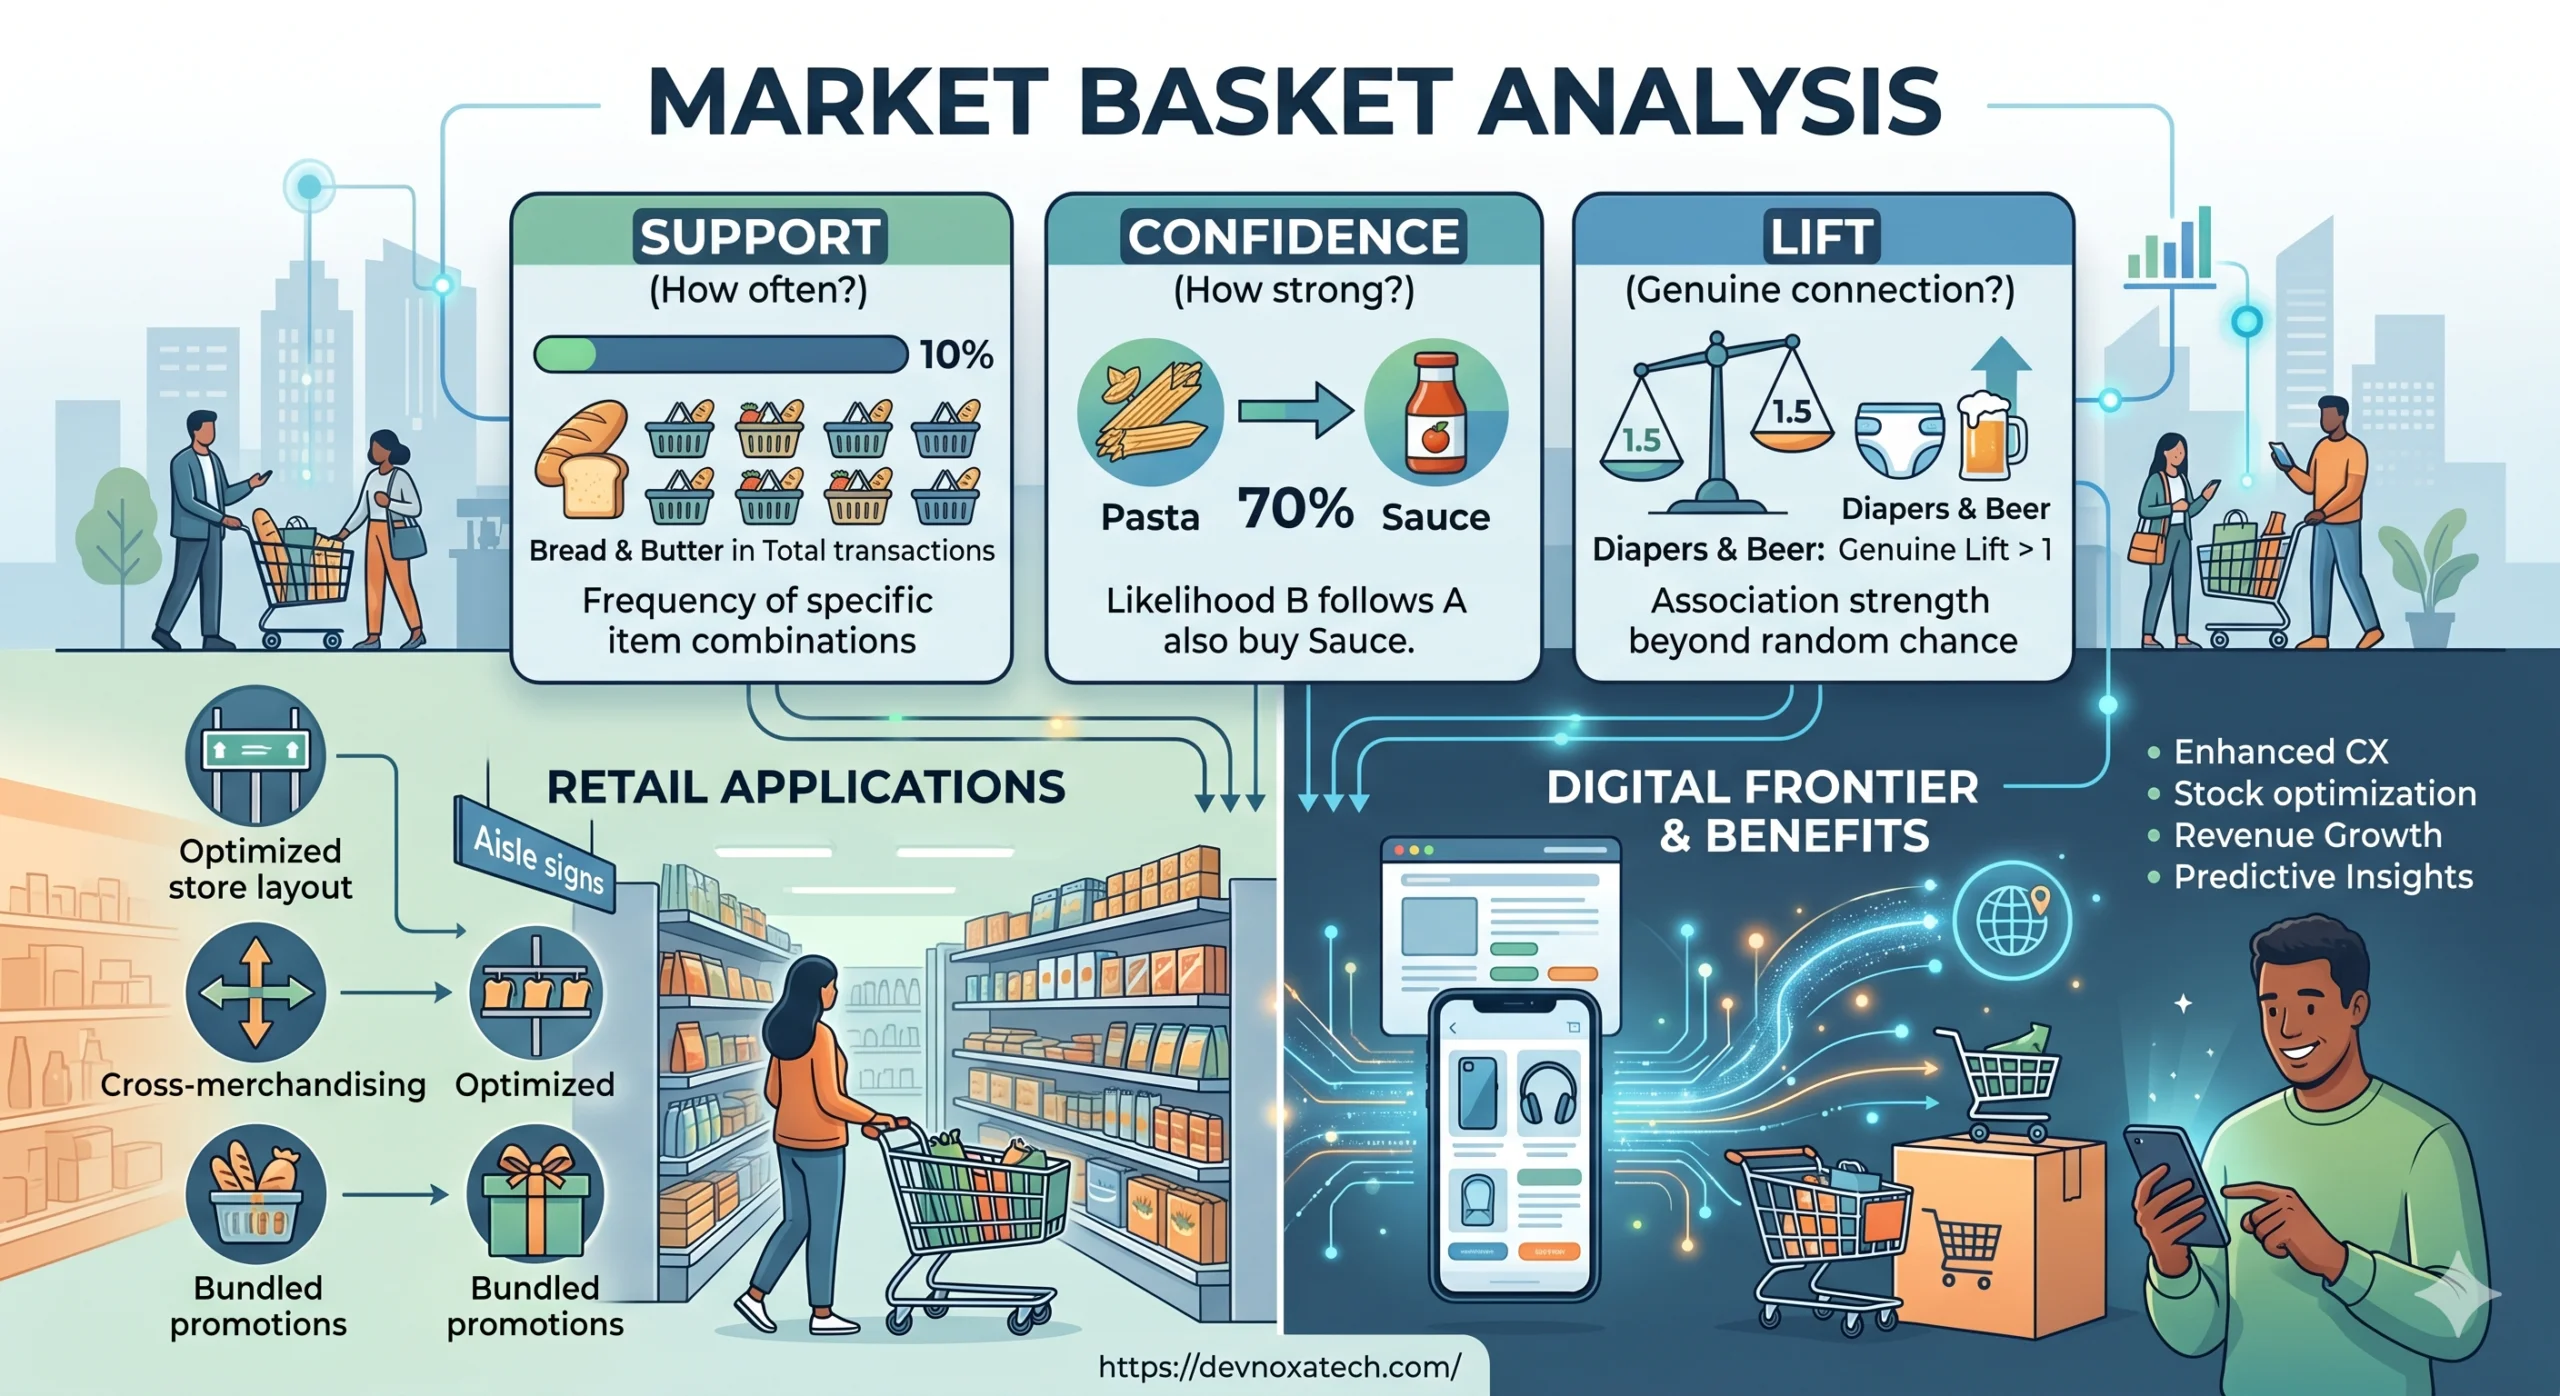
The first metric is Support. This measures how popular an item or an item combination is relative to the total number of transactions. If ten out of one hundred shoppers buy bread and butter together, the support for that combination is ten percent.
The second metric is Confidence. This tells us how certain we are that a customer will buy item B if they have already purchased item A. For example, if seventy percent of the people who bought pasta also bought pasta sauce, the confidence level for this specific rule is high. It gives retailers a direct look at cause and effect relationships in buying habits.
The third and perhaps most important metric is Lift. Lift controls for the overall popularity of the items involved. If everyone buys milk regardless of what else they are purchasing, a high confidence score between bread and milk might be misleading. Lift calculates whether the purchase of item A truly increases the likelihood of purchasing item B. A lift value greater than one means the two items are genuinely associated, while a value less than one means they actually repel each other.
Real World Retail Applications
Once a business uncovers these relationships, the opportunities to boost sales are virtually endless. The most obvious application is physical store layout. Supermarkets intentionally spread staple items like milk, eggs, and bread across the back walls of the store. This forces you to walk past hundreds of other items to reach them. By using market basket data, they can place complementary products right along your path, tempting you into making impulse buys.
Digital storefronts take this a step further through personalized recommendation engines. When Amazon tells you that customers who bought this item also bought another product, they are running an automated, real time version of market basket analysis. It creates a seamless shopping experience where the store dynamically morphs itself to match your current interests.
This data is also incredibly useful for promotional strategies. Retailers frequently put a highly popular item on sale at a loss, known as a loss leader, because they know the market basket data proves customers will purchase highly profitable accompanying items during the same trip. If a store discounts turkeys during Thanksgiving, they easily make their profit back on the cranberry sauce, stuffing, and baking pans that shoppers inevitably bundle into their carts.
Benefits Beyond the Cash Register
The advantages of this analysis extend far beyond just increasing the average order value. It plays a massive role in inventory management and supply chain logistics. If data shows that a spike in the sale of one item always triggers a spike in another, inventory managers can ensure they never run out of stock on complementary goods. There is nothing more frustrating for a shopper than buying a main product only to find the necessary accessory is sold out.
Furthermore, it enhances customer satisfaction. When a store places items logically or suggests products that genuinely solve a problem for the consumer, it reduces shopping friction. The customer spends less time searching the aisles or browsing websites, resulting in a more pleasant and efficient experience that builds long term brand loyalty.
Overcoming Key Challenges
While the benefits are clear, implementing a successful analysis is not without its hurdles. The biggest challenge is dealing with massive volumes of data. Modern retail systems track millions of transactions daily. Sifting through this ocean of information requires significant computing power and smart filtering to separate meaningful correlations from pure coincidence.
There is also the risk of discovering obvious truths that offer zero business value. A data algorithm might proudly report that people who buy a left shoe also buy a right shoe, or that consumers who purchase a toothbrush also buy toothpaste. These findings are functionally useless. The true value lies in finding hidden, non intuitive relationships that a human manager would never guess on their own.
The Future of Consumer Insights
As technology advances, market basket analysis is moving beyond basic historical tracking. With the rise of artificial intelligence and machine learning, predictive models can now factor in external variables like weather patterns, local events, and seasonal shifts.
If a sudden heatwave is predicted for the weekend, advanced algorithms can look at past heatwaves to determine exactly what item combinations will trend, allowing stores to prepare their shelves before the first customer even walks through the door. The integration of mobile shopping apps and digital loyalty programs also allows stores to deliver personalized digital coupons to a customer’s phone the exact moment they pick up a related item from the physical shelf.
Data driven decision making is no longer a luxury reserved for tech giants. It has become a baseline requirement for survival in a highly competitive market. By paying close attention to the stories told by the humble shopping basket, businesses can build deeper connections with their customers, streamline operations, and drive sustainable financial growth.
For businesses looking to harness the power of cutting edge software, data analysis, and digital transformation to optimize their retail strategies, implementing these smart systems is the logical next step toward future success. Learn more about how modern technology can elevate your business operations at devnoxa tech